mother and baby

How we have performed

Revenue

$1,936m

Core1 operating profit

$386m

Reported operating loss

$(747)m

Reported EBITDA2

$488m

Loss to Shareholders

$(843)m

Loss per share

(351.3)c

Core basic earnings per share3

105.0c

Dividend per share

34c

  • 1.Core results are presented to show the underlying performance of the Group, excluding the exceptional items and other adjustments set out in Note 5 in the Notes to the Financial Statements.
  • 2.Earnings before interest, tax, depreciation, amortisation and impairment charges.
  • 3.Core basic earnings per share is reconciled to basic earnings per share in Note 13 in the Notes to the Financial Statements.

Chairman and Chief Executive's Statement

Whilst 2017 was a challenging year for the Group as we faced significant headwinds in our US Generics business, we delivered a solid performance in our Branded and Injectable businesses and our balance sheet remains strong. I am confident in the prospects for the Group both in the short term and the long term.

Download Chairman and Chief Executive's Statement
quotemark graphic

Bringing together all weve learned in the past 40 years, and with our new talent, technologies and expertise, we will continue to deliver on our purpose of providing quality affordable medicines to people who need them."

Said Darwazah
Chairman

Chairman and Chief Executive's Statement

Whilst 2017 was a challenging year for the Group as we faced significant headwinds in our US Generics business, we delivered a solid performance in our Branded and Injectable businesses and our balance sheet remains strong. I am confident in the prospects for the Group both in the short term and the long term.

Said Darwazah
quotemark graphic

Bringing together all weve learned in the past 40 years, and with our new talent, technologies and expertise, we will continue to deliver on our purpose of providing quality affordable medicines to people who need them."

Said Darwazah
Chairman
Download Chairman and Chief Executive's Statement

Our business model

We operate in a competitive, highly regulated industry, across many markets. Our diversified business model enables us to respond to the many opportunities and challenges we face, whilst delivering value for our customers, patients, employees, shareholders and our wider communities.

  • Injectables
  • Generics
  • Branded

Our operations


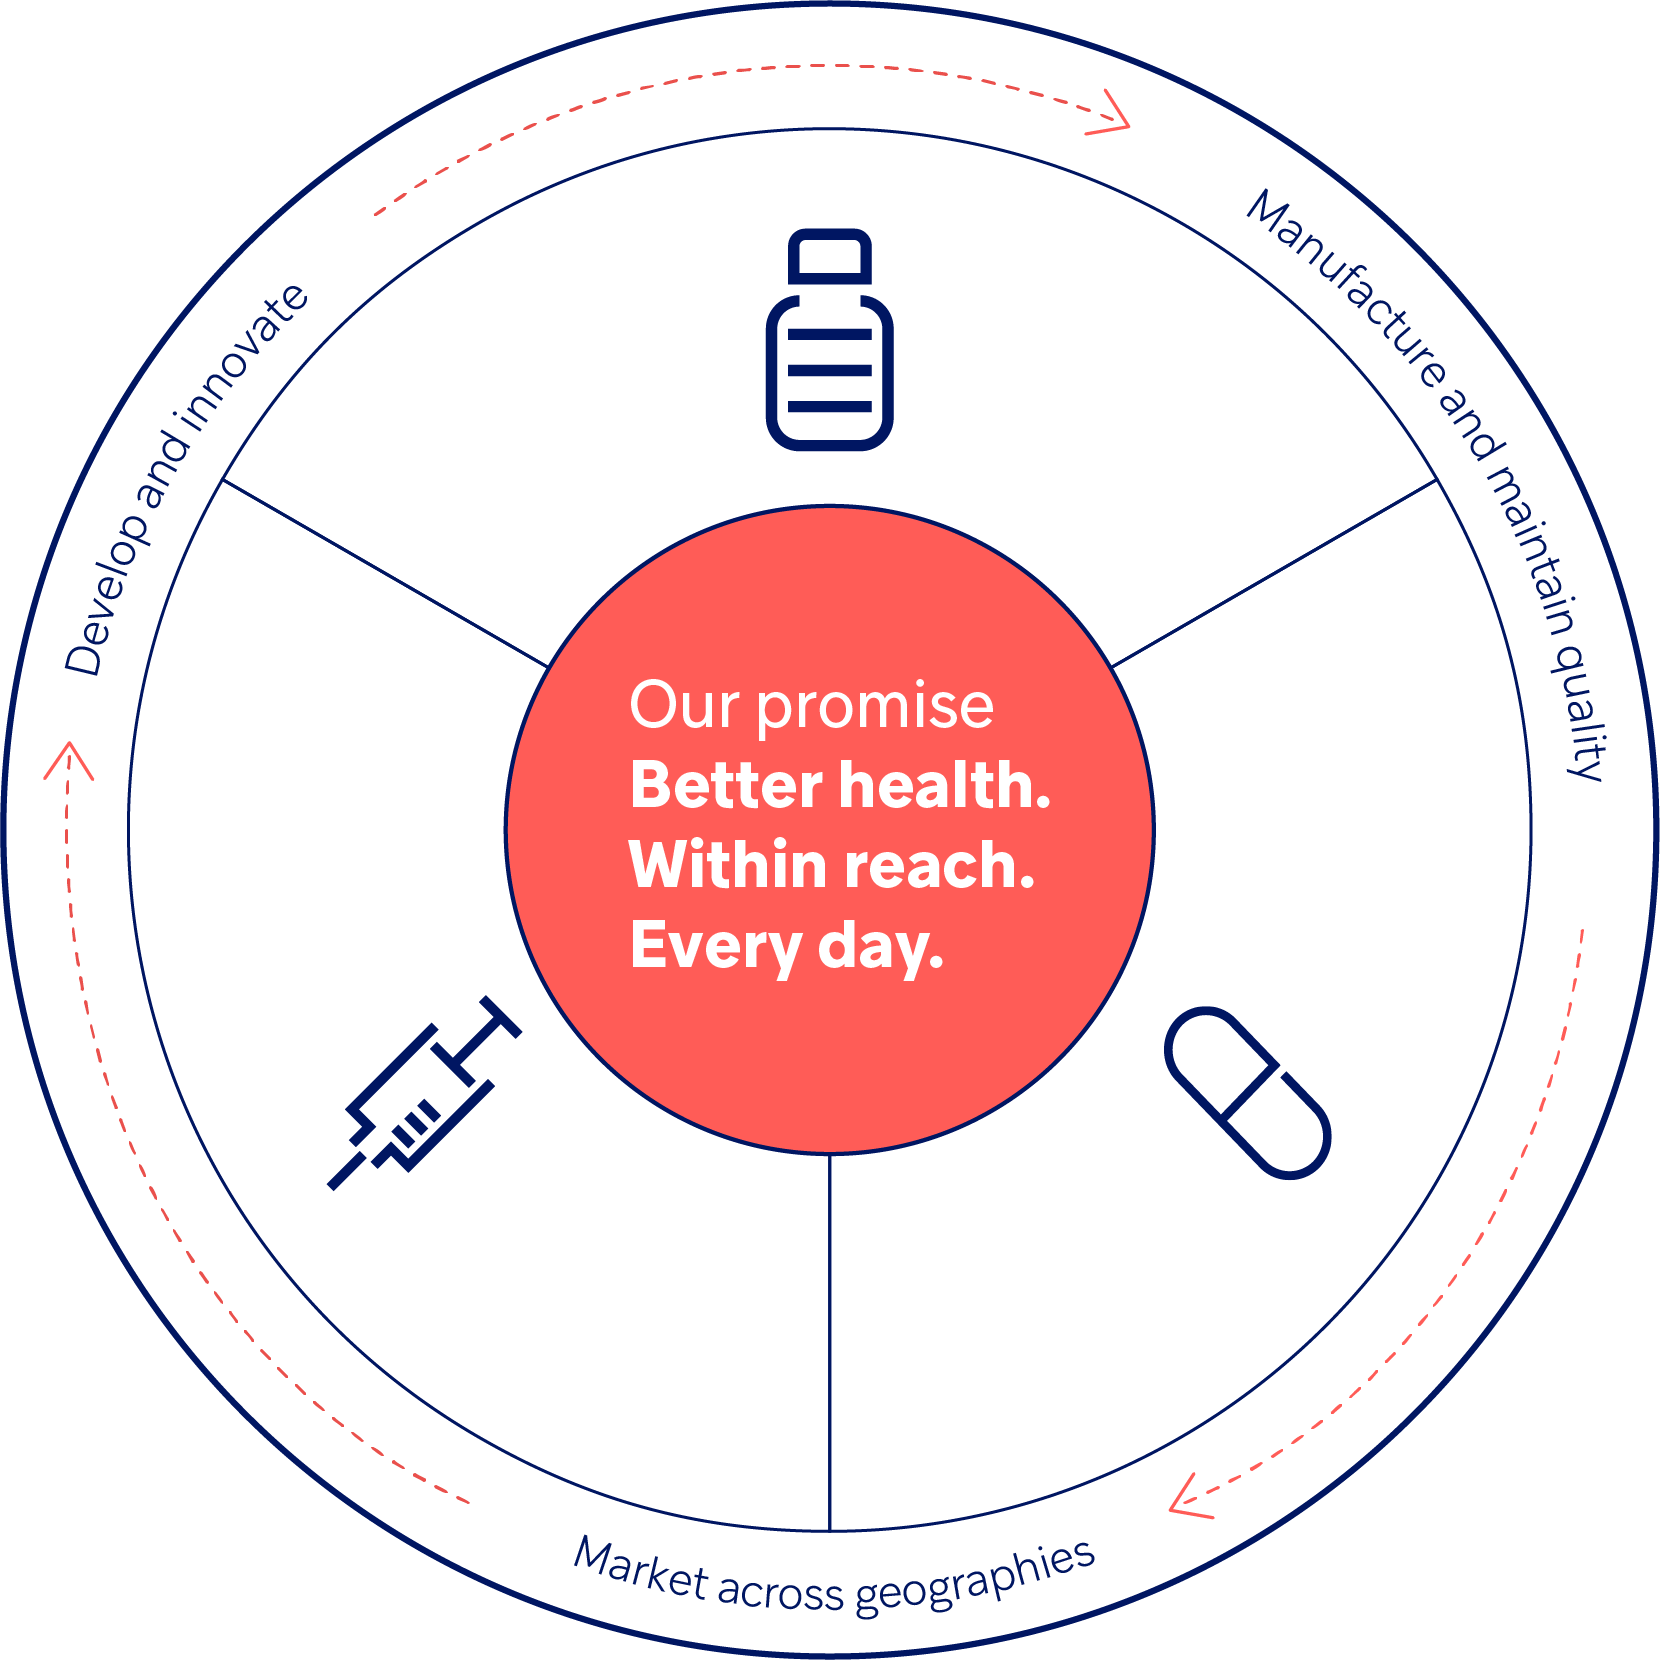
Our Injectables business manufactures, markets and sells generic injectable products in the US, the MENA region and Europe. In the US, we are the third largest manufacturer of injectables by volume.

Injectables

Revenue ($m)

bar graph: Revenue

2016781

2017776

Core operating margin (%)

bar graph: Core Operating Margin

201643.5

201740.6

40% of Group revenue (2016: 40%) pie chart: Segmental revenue
quotemark graphic

While competition is increasing on certain products in the US, we are seeing a good contribution from recently launched new products and strong growth in Europe and the MENA region."


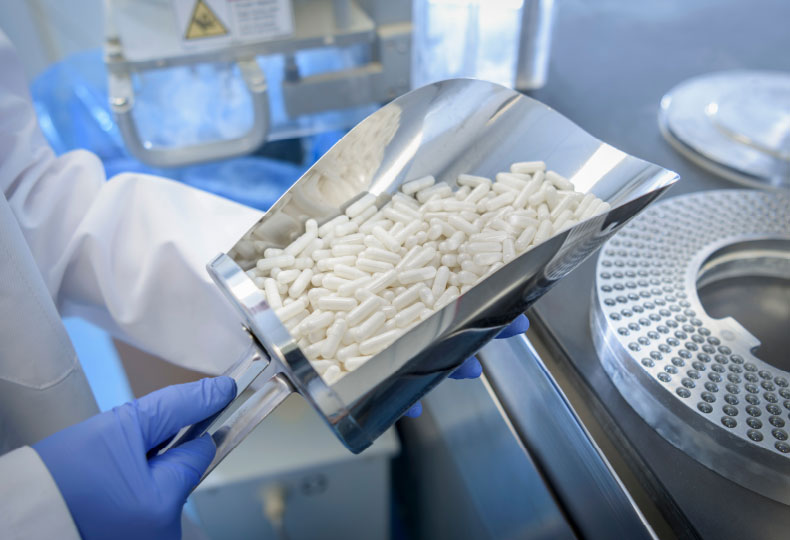
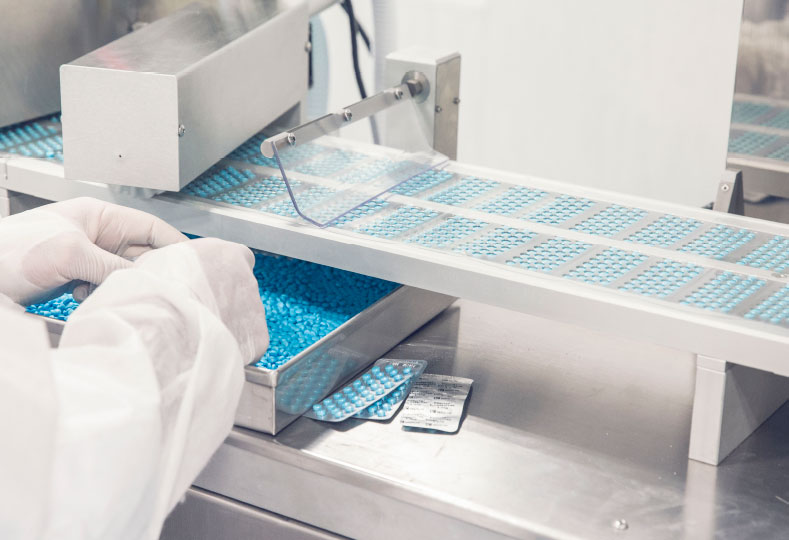
Our Generics business manufactures and markets oral and non-injectable generic products for sale in the United States. We have two manufacturing facilities in the US and US FDA- approved facilities in Jordan and Saudi Arabia. We are the twelth largest manufacturer of oral generics by volume in the US.

Generics

Revenue ($m)

bar graph: Revenue

2016604

2017615

Core operating margin (%)

bar graph: Core Operating Margin

20165.8

20173.6

32% of Group revenue (2016: 31%) pie chart: Segmental revenue
quotemark graphic

We have put in place a new management team to improve our operations, customer relationships and R&D programme."


Our Branded business develops, manufactures and markets branded generics and in-licensed products across 17 MENA markets. We are the fifth largest generic pharmaceutical company in the MENA region and the largest regional player. Our largest markets are Saudi Arabia, Algeria, Egypt, Morocco and Jordan.

Branded

Revenue ($m)

bar graph: Revenue

2016556

2017536

Core operating margin (%)

bar graph: Core Operating Margin

201620.1

201721.3

28% of Group revenue (2016: 29%) pie chart: Segmental revenue
quotemark graphic

We saw a strong acceleration in sales during the second half, and a strong performance in Egypt, the GCC and Sudan leading to growth in constant currency."